2013-06: Do you have a space problem in DB2?

I have recently been involved with trialing and testing our space monitor software on DB2 z/OS.

It was originally designed many moons ago to monitor the size of the secondary extents that DB2 was using and to issue dynamically on-the-fly an ALTER SECQTY to guarantee that the maximum size of the object was reached *before* you ran out of extents.

Now you might be wondering “What’s that got to do with the price of beef?”

Because, as we all know, DB2 V8 introduced a “sliding scale” to the size of the secondary extents so that it could also guarantee that a dataset hit its maximum size *before* you ran out of extents.

So what’s interesting here?
Simply put – both solutions are great until you actually hit the wall!
When you get to the maximum number of datasets – Who is gonna help you??? If it is 01:00 on Saturday morning and your critical production tablespace has got its maximum of 32 datasets – what are you going to do??? Could you actually get the REORG through before prime time starts on Monday morning?? Or what happens when partition 26 completely fills up?

IFCIDs to the rescue!

This is where our tool SAX (Space Assurance Expert) comes in handy. It is a STC that runs 24×7 catching the IFCIDs that DB2 spits out whenever a dataset issues a request for an extent. What it then does is the “clever” bit if you like! Using the DB2 Catalog SAX determines the exact make-up of the object being extended and can use two levels of warning percentages to start triggering alarm bells way, way before it all goes pear-shaped!
Here is my little “ready-reckoner” for Linear Dataset Allocations :

Object type: TABLESPACE      ! Maximum number of data sets 
-----------------------------+---------------------------- 
LOB tablespaces              ! 254 
-----------------------------+---------------------------- 
Non-partitioned tablespaces  ! 32 
-----------------------------+---------------------------- 
Partitioned tablespaces      ! 1 (Percent used check) 
-----------------------------+---------------------------- 
Partitioned By Growth        ! MAXPARTITIONS. LPS check if 
tablespaces                  ! more than one. If on last 
                             ! partition then percent used.
-----------------------------+---------------------------- 

Object type: INDEX ! Maximum number of data sets 
-----------------------------+---------------------------- 
Non-partitioned indexes on   ! MIN ( 4096 , 2 power 32 / 
tablespace with LARGE,       ! ( DSSIZE / TS PGSIZE)) 
DSSIZE, or more than 64      ! Eg: 128 GB DSSIZE with 
Partitions                   ! 8 KB Tablespace Page 
                             ! gives 256 Pieces (datasets) 
                             ! Or 4 GB DSSIZE with 
                             ! 4 KB Tablespace Page 
                             ! gives 4096 Pieces (datasets)
-----------------------------+---------------------------- 
Non-partitioned indexes      ! 32 
otherwise                    ! 
-----------------------------+---------------------------- 
Partitioned indexes          ! 1 (Percent used check) 
-----------------------------+----------------------------

Understand PBG space definitions

Here you can see that it is not as easy as it used to be and you must also make sure you understand PBG space definitions. We allow two percentages and use them in two different ways
1) The number of datasets that have been allocated
2) The used space with a linear dataset
The second is also used if it is a PBG with MAXPARTITIONS 1 (e.g. The DB2 Catalog) or if the partition being extended is the last allowable partition.

These warnings are issued as WTOs and can easily be picked up by system automation tools to open job tickets or send e-mails to alert DBAs days or weeks before the system stops working.

Watch the number of extents

What I have also seen is that the number of extents is sometimes getting very large indeed! One customer had numerous datasets with over 4,000 extents! Now we all know that no-one knows where data is really stored on the modern disk sub-systems but still… I would schedule a reorg at say 1,000 extents! The number of extents changed a *long* time ago in z/OS 1.7 to raise it from 255 to 7,257 spread over 59 volumes *but* still limited to 123 extents per volume. This little nugget of information is *very* important if you are thinking of going down the “one huge EAV volume for all my data” road (These disks can have up to 262,668 cylinders or about 223GB!) as the extents per volume is still there!

In comparison the good old MOD-3s had 3,339 cylinders and 3GB of space.

So what I want to tell you this month is:

1) Check your Linear Dataset Allocations – Are you banging your head on the wall yet?

2) Implement a methodology to warn you in advance!
 Buying our software is the smart route of course!

3) Talk with your storage personnel about space and space management on a regular
basis
.

Finally, our SAX also checks and alerts if your SMS storage groups start getting full.
This is especially handy for your DB2 10 NF Catalog, Copy Pools and Work Storage groups.

As usual any questions or comments are welcome,
TTFN Roy Boxwell
Senior Software Architect

2013-07: Death by Index Probe (DB2 10)

Now this might sound like a James Bond style bad guy’s death threat but actually this has happened at a shop I was at, and so I thought I would share the grisly details with you all!

In DB2 10 IBM increased the intelligence of the Optimizer again and so they introduced the dreaded “index probe”. It is a kind of double check – Is the data really empty?


Index probing is used in three distinct circumstances in DB2 10 any mode:

First is:
1) RUNSTATS reported an empty table
2) RUNSTATS reported empty qualifying parts
3) Catalog statistics are at default
4) A matching predicate is estimated to return zero rows

Second is:
1) Table has the VOLATILE attribute

Third is:
1) Table has fewer than ZPARM NPGTHRSH pages

Now the last two are basically the same – Don’t trust the RUNSTATS as it might have been run at an inopportune time, e.g. when the table was empty, so checking the index to see if there is data there really does make sense.


A quick solution in the past – A killer at present

Now what happened at our customer site was Dynamic SQL PREPAREs started taking up to 30 seconds for some SQL. What was weird was that the SQL was against many partitioned objects (Normally more than 250 and most actually at 999!) using the full partitioned key. The customer checked the statistics – everything fine, REORGed the DB2 Catalog – just in case! No change and then they got the answer from IBM – Remove the VOLATILE keyword!

Now we go back in time … When the customer migrated to DB2 V8 many, many moons ago the access to their, then only 254 partitions, partioned tables got much worse and IBM investigated and said “use the VOLATILE keyword”, and hey Presto! It worked! It also worked for DB2 9 but is a disaster in DB2 10. By the way – the 999 partitions were done “for future growth” and most of the partitions are, of course, empty.
IBM has said that a corrective PTF will come out in September.


Check the access path

Of course simply ALTERing the table to be NOT VOLATILE stopped the disastrous index probe of 999 datasets *but* it also, naturally enough, changed the access paths as well! The customer must now compare all the DB2 9 and DB2 10 dynamic SQL access paths to see what will now go pear shaped… Luckily they have our Bind ImpactExpert with   Early Precheck Dynamic and Static so the task is simple to do but someone must still do it and then analyze the results!
Here’s a little query to show you if *you* have any of these little darlings waiting to go BOOM at your shop…

SELECT SUBSTR(STRIP(A.CREATOR) CONCAT '.' 
       CONCAT STRIP(A.NAME) , 1 , 32 ) AS TABLE
     , MAX(B.PARTITION) AS MAX_PARTS 
FROM SYSIBM.SYSTABLES    A 
,SYSIBM.SYSTABLEPART     B 
WHERE A.SPLIT_ROWS = 'Y' 
AND A.TYPE         = 'T' 
AND A.DBNAME       = B.DBNAME 
AND A.TSNAME       = B.TSNAME 
AND B.PARTITION    > 200 
GROUP BY A.CREATOR, A.NAME 
ORDER BY 1 
;


As usual any questions or comments are welcome,
TTFN Roy Boxwell
Senior Software Architect

2013-11: FREE DB2 HealthCheck


This month, as a thank you to everyone on the News from the Labs „nice“ list, we have a seasonal freebie!

Our DB2 HealthCheck package pinpoints weaknesses and opportunities for improvements and optimization in DB2 z/OS systems.
Just click this link, fill in and select „Healthcheck Freeware“ down the page.
My support colleagues will ship our Licensed Freeware edition of our HealthCheck series or DB2 z/OS.


PerformanceHealthCheck for DB2 z/OS (PHC)

PerformanceHealthCheck for DB2 z/OS (PHC) checks your DB2 subsystem for a range of problems and lists out what it finds including the latest enhancement – the Coupling Facility checker.

I read on listserv about people with “Coupling Facilities under stress” and so I added some CF checks. It checks the six important values in your CF. The Level of the microcode, the transfer time, the number of rejects, the false contention percentage, the subchannel busy percentage and finally the all paths busy count. From these KPIs you can see if your CF is “under stress” or not! Now to get all this juicy data the LOAD library *must* be APF authorized of course!

Remember that the normal Performance HealthCheck still runs fine without being APF auth’d just the CF check must be.


Statistics HealthCheck for DB2 z/OS (SHC)

Along with PHC comes Statistics HealthCheck for DB2 z/OS (SHC), which lots of you may already be familiar with. It allows you to analyze and assess a complete DB2 subsystem down to a single database and tell you what is ʺwrongʺ or inconsistent with your DB2 catalog statistics.

This enables you to determine any problems before they get bad and to improve performance by providing the DB2 Optimizer with better information from which it can base its cost estimate on. It fully supports and is compliant for DB2 10. It is a perennial favorite and you cannot run it enough. Especially when you’re going to migrate to a new DB2 version, this software is a must to protect yourself from strange optimizer behavior.


The binaries come with the products documentation with a full feature overview that summarizes what our PHC can do for you!
As usual any  questions or comments are welcome,
TTFN Roy Boxwell
Senior Software Architect
2013-09: Roy’s first DB2 11 review

Well now I can finally talk about DB2 11 for the first time …

We have had it for over a year now and have been in the ESP from the beginning. In this newsletter I want to give you a „first look“ at what I think is cool, great or odd!


DB2 11 – here’s my personal list of *brilliant* down to *why*?

Brilliant
Great
Useful
Why?


Brilliant

REORG TP with NPSIs got a nice boost in performance and the new ability to do TP copies during a DSNUM ALL REORG is *very* good. REORG can now do much better and faster inline statistics including histograms. The switch phase got a massive boost as well. Mapping tables also became history in this release! You can finally drop ‘em all from your system. DB2 will create and use them on the fly. In NFM you *must* use the new format mapping table so you might as well let DB2 do the work for you!
RUNSTATS now works *without* a profile – Hooray! Terry Purcell can now sleep better at night but the update of the RTS TOTALROWS and TOTALENTRIES is *still* only done if you run with SHRLEVEL REFERENCE – and how many of you do that?? A new option RESET ACCESSPATH finally gives you the chance to *remove* all access path data in the catalog for the given objects. This then enables a new RUNSTATS to collect only the information you actually need/want. ZiiP offload has been greatly increased as well.
For the Optimizer there is Index Skipping to enable faster duplicate discarding processing, a new In Memory Data Cache (IMDC) to enable better run time optimizer choice depending on the current amount of free memory (This memory cache value (MXDTCACH) is default 20MB and can be increased) and a bunch of new query rewrite techniques to help „automatic bad SQL generators“ get a chance of index access. E.g. WHERE YEAR(date_column) = 2013 is rewritten to WHERE date_column BETWEEN ‚2013-01-01‘ AND ‚2013-12-31‘. Finally OR and IN list with NULLs gets a rewrite boost as well so WHERE COLUMN IN (‚A‘, ‚Y‘) OR COLUMN IS NULL is simply rewritten to COLUMN IN (‚A‘, ‚Y‘, NULL). All these changes allow index usage where it was not possible before.

The optimizer team also delivered a seriously good boost for embedded CASE structures that used to be anathema to DBAs:

SELECT COL2, COL3
FROM TAB1
WHERE COL1 = CASE (CAST(? AS INT))
             WHEN 1 THEN 'R'
             WHEN 2 THEN 'O'
             ELSE 'Y'
             END
;

SELECT TAB2.COL1, TAB1.COL2, TAB2.COL2
FROM TAB1, TAB2
WHERE TAB2.COL1 = CASE WHEN TAB1.COL1 = 'Y'
                  THEN TAB1.COL2
                  ELSE TAB1.COL3
                  END
;

Both of these used to be stage2 but now can actually use indexes!


Great

Expanded LRSN from six to ten bytes. DB2’s six byte RBA meant it could store 2 to the power of 48 bytes of data on the Log or 256TB of data. Back in the late 80’s this was thought to be „more than enough“ … So now we have 2 to the power of 80 or 1YB. Yep, that’s a Yottabyte of Log! This is optional but from NFM on DB2 will internally always store ten bytes – the externalized data is dependent on whether you do the migration or not. However, it is highly recommended as you will get a small performance hit to convert down to six bytes. The other boost this gives is a reduction in spins waiting for a unique LRSN in data sharing which – with the faster and faster hardware – was becoming a bottleneck.

DSN1COPY – The first time a dataset is opened for normal business after a DSN1COPY, some basic „sanity“ checks are run to try and flag „bad“ DSN1COPY runs before too much work, hopefully any, has actually been done. This is very handy as the DSN1COPY is notoriously difficult with its parameters and input control cards.

AUTOSIZE on Bufferpools gets a wonderful fix to stop „runaway“ autonomic mismanagement. In other words, you can set upper and lower bounds which will *not* be exceeded – very nice!

Pseudo-empty index page cleanup daemon – A very nice „set it and forget it“ feature that actually removes completely empty pages from indexes, thus reducing the need for REORG INDEX and boosting performance.


Useful

Global Variables – Pretty handy feature in DB2 11 to easily pass data along a chain of programs. A bit like a SPA in good old IMS!

JVM only being started once and using 64 Bit storage is a major winner for most shops as nearly everyone uses JAVA these days and sometimes even on Big Iron.

Archive Tables – Similar to „time travel“ tables from DB2 10 but looked upon as an „extension of the current table“. This is very handy indeed when all you want is a bucket to throw any DELETEs into. Plus you can use this bucket as input to be added to the current table or not – Very nice feature this!

DROP COLUMN – I will be using this as I have *always* : created a copy table, cross loaded it, dropped the original table, created the new table without the column, cross loaded back to it, created any dependent views, GRANT access back. Reorg, Runstats, Rebind – Done *phew*. Now you can simply Drop the column and then schedule a reorg and you are also done!

Autonomous procedures – This gives the chance to COMMIT any work done *just* in the stored procedure. The main task can still ROLLBACK but that will not affect the data COMMITted in the proc. This could be very handy or a complete disaster depending on your business logic!

Faster recovery of directory data because certain directory tables/indexes update RBA/LRSNs are now stored in the SYSLGRNX. This is a very good feature for recovery of catalog objects of course!


Why?

GROUP BY multiple columns and aggregates has been added – now here is another new SQL feature, like OLAP queries, that nearly no-one will ever use!

Enforce NUMTCB=1 for stored procedures … this is an enhancement?!?!?

And last but not least

Finally my personal little favorite – LIKE_BLANK_INSIGNIFICANT is a new ZPARM – it makes the rules for LIKE of static and varchar get a little bit more aligned. This is, of course, a change in behavior and you must make sure that your programs react as you still think they should!


That’s all for now –next time I will dive into details on some of the above topics.
If anyone has any wishes please email me and I will see what I can do!

As usual any questions or comments are welcome,
TTFN Roy Boxwell
Senior Software Architect

2013-08: Inline LOBs

In DB2 10 you can now define LOBs to also be „inline“.

This small feature is actually fantastic for performance and general use and I urge all DB2 users to evaluate using them!

What they enable is the use of just the „base“ table space and not the aux (LOB) space at all! This is a very good thing as LOB access can(!) sometimes be painfully slow and cause bottlenecks in the processing.


In the DB2 10 Performance guide Chapter 4.3 there is a nice list of benefits:

Inline LOBs offer the following performance advantages over LOBs that are stored in auxiliary tables (sometimes called outline LOBs):

  • Disk space savings because two LOBs cannot share a page on a LOB table space
  • Disk space savings because the inline portion of a LOB can be compressed
  • Synchronous I/Os to the AUX index and LOB table space are avoided
  • CPU savings associated with accessing the AUX index and LOB table space
  • Sequential and dynamic prefetch I/O for LOBs
  • Improved effectiveness of FETCH CONTINUE when scanning rows
  • Index on expression can be enabled for LOB data

Note the LAST one which I think is actually one of the best reasons!!!


Obviously there are a few „considerations“:

  1. Check how long your LOBs are now and try to size for the 80 / 20 rule
  2. Remember that the Page size and the related BP size will need to be adjusted and tuned
  3. If you rarely use the LOB column then don’t bother!
  4. If going from „old“ style space to an inline LOB with compression then you must do a sort of triple jump:

a. ALTER to get a UTS and also in RRF format – REORG to action
b. ALTER to get INLINE LOB usage – REORG to action
c. Now REORG it again to actually get COMPRESSION as that is not done by the earlier REORGs!


An example SQL from the DB2 Performance chapter 4.3

Here’s an example SQL that I took from the DB2 Performance chapter 4.3 and changed a little to report  more info:

WITH LOB_DIST_TABLE (LOB_LENGTH                    
                    ,LOB_COUNT)                           
AS (                                               
    SELECT LOBCOL_LENGTH                                 
            ,COUNT(*)                                       
    FROM (                                           
    SELECT ((LENGTH(STATEMENT) / 1000) + 1) * 1000 
            AS LOBCOL_LENGTH                     
            FROM SYSIBM.SYSPACKSTMT                     
            ) LOB_COL_LENGTH_TABLE                      
    GROUP BY LOBCOL_LENGTH                               
   )                                                     
SELECT '01000' AS SIZE                                   
       ,COALESCE(SUM(LOB_COUNT) , 0) AS COUNT                 
       ,(COALESCE(SUM(LOB_COUNT) , 0) * 100.00) /               
        (SELECT SUM(LOB_COUNT) FROM LOB_DIST_TABLE) AS PERCENTAGE
FROM LOB_DIST_TABLE                                             
WHERE LOB_LENGTH <= 1000                                       
UNION ALL                                                      
SELECT '02000' AS SIZE                                         
,COALESCE(SUM(LOB_COUNT) , 0) AS COUNT                   
,(COALESCE(SUM(LOB_COUNT) , 0) * 100.00) /               
(SELECT SUM(LOB_COUNT) FROM LOB_DIST_TABLE) AS PERCENTAGE

FROM LOB_DIST_TABLE                                            
WHERE LOB_LENGTH <= 2000                                       
UNION ALL                                                      
SELECT '04000' AS SIZE                                         
       ,COALESCE(SUM(LOB_COUNT) , 0) AS COUNT                   
       ,(COALESCE(SUM(LOB_COUNT) , 0) * 100.00) /               
        (SELECT SUM(LOB_COUNT) FROM LOB_DIST_TABLE) AS PERCENTAGE
FROM LOB_DIST_TABLE                                            
WHERE LOB_LENGTH <= 4000                                        
UNION ALL                                                      
SELECT '08000' AS SIZE                                         
,COALESCE(SUM(LOB_COUNT) , 0) AS COUNT                   
,(COALESCE(SUM(LOB_COUNT) , 0) * 100.00) /                
(SELECT SUM(LOB_COUNT) FROM LOB_DIST_TABLE) AS PERCENTAGE
FROM LOB_DIST_TABLE                                             

WHERE LOB_LENGTH <= 8000                                       
UNION ALL                                                        

SELECT '12000' AS SIZE                                         
,COALESCE(SUM(LOB_COUNT) , 0) AS COUNT                   
,(COALESCE(SUM(LOB_COUNT) , 0) * 100.00) /               
(SELECT SUM(LOB_COUNT) FROM LOB_DIST_TABLE) AS PERCENTAGE
FROM LOB_DIST_TABLE                                            
WHERE LOB_LENGTH <= 12000                                      
UNION ALL                                                       

SELECT '16000' AS SIZE                                          
,COALESCE(SUM(LOB_COUNT) , 0) AS COUNT                   
,(COALESCE(SUM(LOB_COUNT) , 0) * 100.00) /               
(SELECT SUM(LOB_COUNT) FROM LOB_DIST_TABLE) AS PERCENTAGE

FROM LOB_DIST_TABLE                                            
WHERE LOB_LENGTH <= 16000                                      
UNION ALL                                                       

SELECT '20000' AS SIZE                                          
,COALESCE(SUM(LOB_COUNT) , 0) AS COUNT                   
,(COALESCE(SUM(LOB_COUNT) , 0) * 100.00) /               
(SELECT SUM(LOB_COUNT) FROM LOB_DIST_TABLE) AS PERCENTAGE

FROM LOB_DIST_TABLE                                             
WHERE LOB_LENGTH <= 20000                                      
UNION ALL                                                      

SELECT '24000' AS SIZE                                        
,COALESCE(SUM(LOB_COUNT) , 0) AS COUNT                  
,(COALESCE(SUM(LOB_COUNT) , 0) * 100.00) /              
(SELECT SUM(LOB_COUNT) FROM LOB_DIST_TABLE) AS PERCENTAGE
FROM LOB_DIST_TABLE                                           
WHERE LOB_LENGTH <= 24000                                      
UNION ALL                                                     
SELECT '28000' AS SIZE                                        
      ,COALESCE(SUM(LOB_COUNT) , 0) AS COUNT                  
      ,(COALESCE(SUM(LOB_COUNT) , 0) * 100.00) /              
       (SELECT SUM(LOB_COUNT) FROM LOB_DIST_TABLE) AS PERCENTAGE
FROM LOB_DIST_TABLE                                           
WHERE LOB_LENGTH <= 28000                                     
UNION ALL                                                      
SELECT '32000' AS SIZE                                        
      ,COALESCE(SUM(LOB_COUNT) , 0) AS COUNT                  
      ,(COALESCE(SUM(LOB_COUNT) , 0) * 100.00) /              
       (SELECT SUM(LOB_COUNT) FROM LOB_DIST_TABLE) AS PERCENTAGE
FROM LOB_DIST_TABLE                                           
WHERE LOB_LENGTH <= 32000                                     
UNION ALL                                                     
SELECT '99999' AS SIZE                                        
      ,COALESCE(SUM(LOB_COUNT) , 0) AS COUNT                  
      ,(COALESCE(SUM(LOB_COUNT) , 0) * 100.00) /              
       (SELECT SUM(LOB_COUNT) FROM LOB_DIST_TABLE) AS PERCENTAGE
FROM LOB_DIST_TABLE                                           
WHERE LOB_LENGTH >  32000                                     
ORDER BY 1                                                    
;

Now it returns this data:

---------+---------+---------+-------
SIZE         COUNT           PERCENTAGE
---------+---------+---------+-------
01000       112102              95.66
02000       115957              98.95
04000       116771              99.65
08000       117044              99.88
12000       117110              99.94
16000       117140              99.96
20000       117173              99.99
24000       117174              99.99
28000       117175              99.99
32000       117176             100.00
99999            0                .00

DSNE610I NUMBER OF ROWS DISPLAYED IS 11
As can be seen just changing the inline LOB length to be 1000 bytes would „hit“ over 95% of the rows!
This might even mean no change to page size and/or bufferpool would be needed!

Remember to change the driver CTE to be your candidate LOB column and table as here I have used STATEMENT and SYSIBM.SYSPACKAGE.


Return the LOB column names and tables needed

Here’s a little query, taken from the performance book and enhanced/corrected, to return the LOB column names and tables needed:

SELECT SUBSTR(CO.NAME , 1 , 30) AS COLUMN_NAME              
,STRIP(CO.TBCREATOR) CONCAT '.' CONCAT STRIP(CO.TBNAME)
                                AS TABLE_NAME               

FROM SYSIBM.SYSCOLUMNS CO                                   
WHERE CO.COLTYPE IN ('BLOB' , 'CLOB' , 'DBCLOB')            
  AND NOT EXISTS (SELECT TB.NAME                            
                  FROM SYSIBM.SYSTABLES TB                  
                  WHERE TB.NAME    = CO.TBNAME              
                    AND TB.CREATOR = CO.TBCREATOR           
                    AND TB.TYPE    = 'X')                   
ORDER BY 2 , 1
;                                              

Create an index

One very nice feature is the ability to create an index on expression:

 CREATE INDEX IQATW005.LOB_IOE_IX      
  ON IQA0610.IQATW005                  
    (CHAR(SUBSTR(SQL_TEXT , 1 , 254)) )
     USING STOGROUP SYSDEFLT            
          PRIQTY    14400              
          SECQTY    14400              
     ERASE NO                           
     FREEPAGE    5                      
     PCTFREE     5                      
     BUFFERPOOL BP0                     
     CLOSE YES                          
;

Only available for SUBSTR and with fixed start and end but still very useful as you can now „scan“ the text in your WHERE clauses!

The performance benefits can be immense for in-line LOBs and so I recommend a quick test and then roll-out to production!
As usual any questions or comments are welcome,
TTFN Roy Boxwell
Senior Software Architect
2013-10: DB2 11 Expanded RBA/LRSN

Now if you were a good attendee at the IOD (and paid attention to the freebies!), you probably got a free copy of the great little book „DB2 11: „The Database for Big Data & Analytics“.

If you did not get a copy at the IOD you can download a free electronic copy here.


On page 30 there is the following text:

   “Implementation of the expanded RBA/LRSN formats is optional but highly recommended as DB2 11 will use 10-byte values internally when in NFM, and there will be a small performance penalty for converting these to old Format”

Italics added by me of course!

Now this caused a couple of questions at the IOD as how to manage a REORG of the whole world. So my newsletter this month is to suggest a way to do this without just REORGing everything from DB 0 to DB Z!


How to manage a REORG without just REORGing everything from DB0 to DBZ ?

1) Be on *usage* metric
Start with your “known suspects” list – Every shop has a top ten list of SQLs normally based on CPU. What you must do is change this list to not be on CPU but on *usage*. The trick is how to actually do this! Well, I would start with the average executes per hour for all objects (To get this metric you must EXPLAIN or have the EXPLAIN data). Obviously the objects at the top of this list should be REORGed first!

2) 50 Reorgs a night
Get your system automation or DB2 Database Maintenance system to use the above data to drive, say, 50 Reorgs a night *purely* based on usage metrics

3) Wait

4) You’re done when no more REORGs are triggered for this metric

Of course it would be easier if all the data was there in front of you but then you would need our SQL WorkLoadExpert (WLX) to get the usage metrics which is, of course, linked to our RealTime DBAExpert (RTDX) which takes care of the REORGs but I digress…


SYSCOPY’s handling

What is also “interesting” is the way SYSCOPY handles all of this… If you select the LENGTH of the START_RBA before the CATENFM job has REORGed SYSCOPY you will get 6 back. After the CATENFM has done SYSCOPY you then get 10 back. This way your “home grown” systems can “know” if the RBA is 6 or 10 Bytes…

SELECT LENGTH(START_RBA)
FROM SYSIBM.SYSCOPY 
FETCH FIRST 1 ROW ONLY 
;

RBA & LRSN extensions

The next interesting point is that a RBA has been extended on the left and a LRSN has been extended on the left *and* the right. So you need to be aware of whether or not the row was written in a data-sharing environment. Probably not that interesting to most people as their shops are one or the other and not normally a mix, but for our software we must know what is in the START_RBA so we use a little CASE to do the work for us if running in DB2 V8, 9 or 10:

CASE WHEN GROUP_MEMBER > ' ' 
     THEN 
          SUBSTR(X'00' CONCAT START_RBA CONCAT X'000000' , 1 , 10)
     ELSE 
          SUBSTR(X'00000000' CONCAT START_RBA , 1 , 10)
END


The last thing I will mention this month is the SYSLGRNX format has changed which might catch a few people out if you are using CI style programs to read it! The DB2 11 NFM version is now in a segmented space and has the extended trailer so beware!

As usual any questions or comments are welcome,
TTFN Roy Boxwell
Senior Software Architect

2014-01: Complementing IBMs ACCESS PLAN Stability


Part 1: Dynamic SQL

with SEGs complete RUNSTATS Rescue package: Why it is a good idea but why it fails in certain cases?

The story

This month I want to tell you a story. This story is true, but the names have been changed to protect the innocent! A big company regularly scheduled production staging on Thursday nights. One night last year everything went as normal – until the Friday morning…

… then the telephones started ringing, and people were complaining about slow or non-existent response times for a rather critical business application.

The problem quickly escalated from the standard “Help desk”-level answers of „Switch it off and on, reboot“, and “Have you changed anything?” to senior managers demanding to know why things were not working anymore.  At this point, the DBA group was not actually involved, as it was first thought that a “bad” package had been promoted “by accident” on the night before.

  • The production group backed out the staged packages, but it didn’t help…
  • The delays got worse. They then stopped nearly all of the WebSphere Servers to at least allow *some* work through the over loaded system. Now in full panic mode, the DBA and the JAVA teams got involved.They both quickly found the “culprit”, which was an extremely large and complex dynamic SQL statement that had worked fine until some time Thursday night, and was now behaving *very* badly indeed.
  • The DBA team REORGed the “big” tables involved, in the hope that it would then all get better… It didn’t.
  • Finally the DBA team proposed creating a new index which was quickly done and  RUNSTATed in production.

The SQL then switched the access path back to a good one. The WebSphere servers were all re-started, and gradually everything returned to normal. This whole process actually took two days! The company involved relies upon its logistics chains and Just-In-Time delivery, so this outage had some serious repercussions, of course…    Get the full story


What really happened?

The DBA team then investigated further and found out that what had really happened, was that a RUNSTATS, on just one small table, had been run on the Thursday night at “an inappropriate time” thus causing the statement’s access path to go „pear-shaped“(aka Belly Up) all day Friday and half of Saturday…

How to fix the problem quickly and easily?

The DBA team then thought about ways that such a problem – should it reoccur in the future – could be quickly and easily fixed. Now my part of the story begins… This company uses our software and had a license to run the Enterprise Statistics Distribution (ESD) component of Bind ImpactExpert, which extracts, and optionally converts, all of the DB2 Catalog data that the DB2 Optimizer needs to do its job. Normally, customers use this to copy all the production statistics over to a sand box style system, to see if a DB2 APAR or DB2 Migration will cause unforeseen problems. For this, they use the Early-PreCheck component of our tool Bind ImpactExpert for Dynamic or Static SQL. Now we do have another scenario, called DSC (Dynamic Statement Cache) Protection, that would nearly do what they wanted, but also does a lot more and, of course, costs more to use! And so arose the idea for our new PocketTool called RUNSTATS Rescue. “Why is it a PocketTool?” I hear you ask “Because it only costs pocket money!” (aka Pin Money in the USA or an „allowance“ if you prefer) These tools are inexpensive to use – really! Now, before you stop reading at this point and start complaining about the fact this Newsletter is just 100% Marketing, please bear in mind that what I describe here could also be written by you – then you just need to give me credit for sharing the idea…

RUNSTATS Rescue

The idea is to use EXPLAIN in any way, shape or form, either in SPUFI, or directly in any monitor, to simply EXPLAIN the “culprit” SQL, and to remember the PLAN_TABLE owner you are using, as well as the QUERYNO you just used. Using these two inputs, RUNSTATS Rescue analyses the EXPLAIN output to build a list of extract and update control cards for our ESD, for all of the tables used and *all* of the indexes – even those *not* used, of course! Finally a DSC flush RUNSTATS is also generated for all Tablespaces involved in the query to make sure that the next time this “culprit” SQL comes into the system, it will then use the correct statistics.

Now, of course, the question is: „How do I know which statistics to use as the Rescue statistics?“

The answer: “The ones that were there before you did a REORG with inline RUNSTATS or a stand-alone RUNSTATS”. This is the key point to bear in mind: You must simply run the ESD extract before any normal DB2 Database maintenance jobs run. Most shops have days, or weekends, when they run these, and it is not a problem to extract the data and then copy it, for example, to a GENGROUP, to enable easily finding the date and time of the last extract when the statistics were “good”, thus enabling the RUNSTATS Rescue job to revert the required statistics very quickly. This gives the DBA group much-needed time to find out what really happened and take any appropriate action – almost – at their leisure.

10 Rescue Steps

  1. Select the new scenario RUNSTATS Rescue
  2. Generate some JCL
  3. Optionally copy to a GENGROUP dataset
  4. Insert the EXPLAIN TABLE-CREATOR and QUERYNO
  5. Automatic launch of our catalog browser
  6. Drill down to the Index level
  7. Ask “new” file name for the extracted “rescue” statistics
  8. Perform the RUNSTATS Rescue extraction
  9. Reset the statistics and executes the RUNSTATS
  10. The „Rescued“ Statistics

Top of page

Here’s a walkthrough example of how it looks in real life:

News 2014-01 Bild1

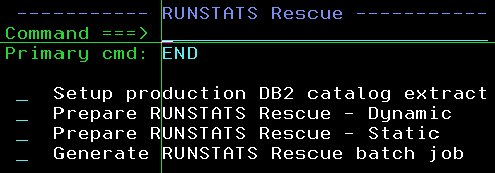
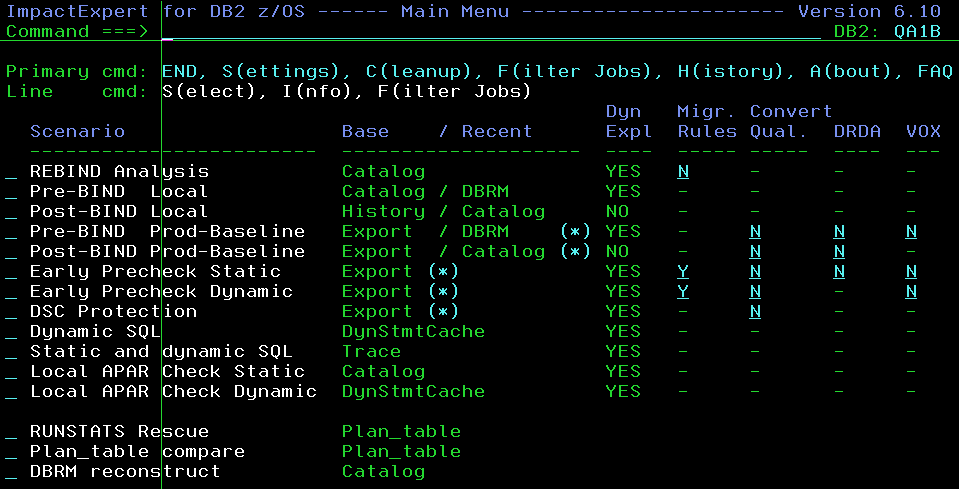
Near the bottom, you can see the new scenario RUNSTATS Rescue – select it to get a little pop-up window with the three steps. The first step must only be done once and then simply be plugged into an existing production job. I would recommend the first job of the normal DB2 Database Maintenance job stream.

1 – Select the new scenario RUNSTATS Rescue in the little pop-up window with the three steps

2 – Generate some JCL

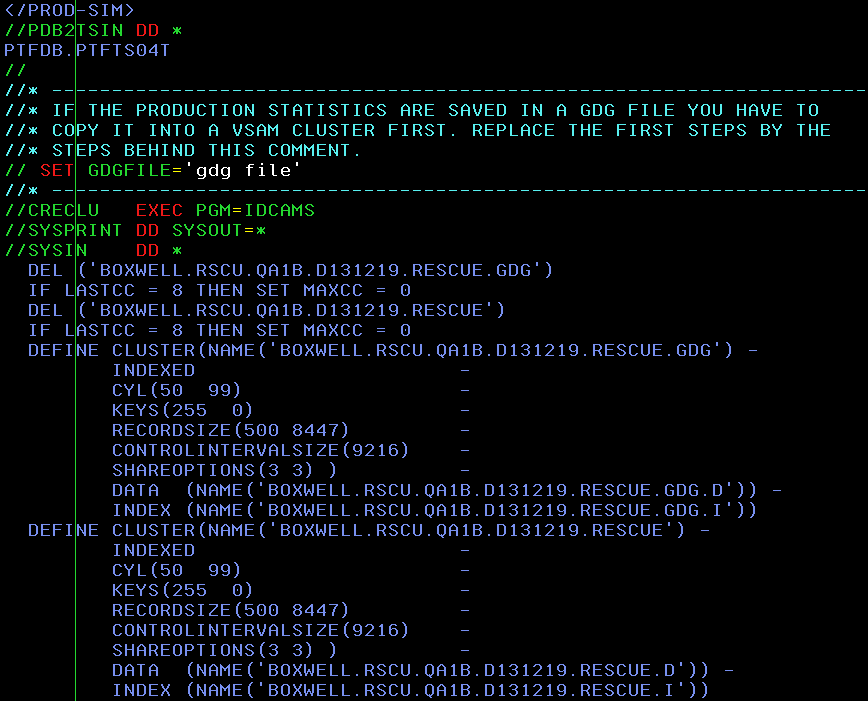
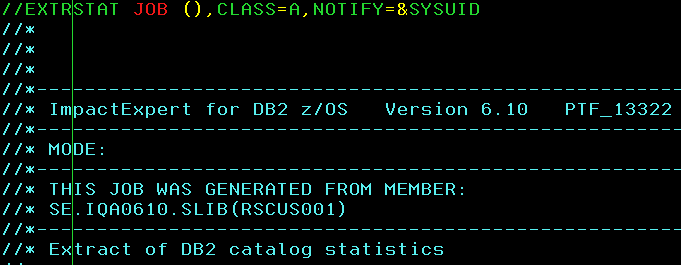
The first option just generates some JCL looking like: News 2014-01 bild3

3 – Optionally copy to a GENGROUP dataset

At the end the optional step to copy to a GENGROUP dataset News 2014-01 bild4

4 – Insert the EXPLAIN TABLE-CREATOR and QUERYNO

Selecting the second option then requests the required input data as discussed earlier News 2014-01 bild5

5 – Automatic launch of our catalog browser

Hitting „enter“ then launches our catalog browser to enable you to see which objects were being used by that SQL… News 2014-01 bild6

6 – Drill down to the Index Level

News 2014-01 bild7

7 – Ask “new” file name for the extracted “rescue” statistics

PF3-ing out of the tool then asks for your original Production Statistics datasets, as extracted by the job in the first step, and a “new” file name for the extracted “rescue” statistics: News 2014-01 bild8

8 – Perform the RUNSTATS Rescue extraction

The next JCL appears that performs the RUNSTATS Rescue extraction, including the optional steps for GENGROUP support, as seen here: News 2014-01 bild9

9 – Reset the statistics and executes the RUNSTATS

Finally, the third option is selected, which actually resets the statistics and executes the RUNSTATS to flush the DSC News 2014-01 bild10

10 – The „Rescued“ Statistics

Now the next time that statement appears, it will use the “rescued” statistics and get back its old Access Path.   Top of page

Next Month

Next month I wish to expand upon this topic with the capability of doing the same for Static SQL. The month after that, I will go into detail about the DSC Protection scenario I mentioned earlier. That is not a pocket tool, of course, but it *is* very interesting!   As usual any questions or comments are welcome, TTFN Roy Boxwell Senior Software Architect

2014-02: Complementing IBMs ACCESS PLAN Stability


Part 2: the Story continues for Static SQL…


Welcome back to the second part of this newsletter.
Remember that last month I talked about a nasty real-world event that caused pain and grief to a large number of fellow DBAs?


Short reminder of part 1: rescue Dynamic SQL

A big company regularly scheduled production staging on Thursday nights. One night last year everything went as normal – until the Friday morning……then the telephones started ringing, and people were complaining about slow or non-existent response times for a rather critical business application…

See the previous newsletter here and the  walk through” example for Dynamic SQL rescue.


The Story continues for Static SQL

Well that was “only” Dynamic SQL that was killing them.

SOFTWARE ENGINEERING GmbH created the new Pocket Tool: RUNSTATS Rescue to gallop over the hill and rescue them from bad statistics timing problems.

…Everyone then lamented “But my Static SQL *also* goes horribly wrong if the statistics are badly timed. What can SEG do there?“


Rescue Static & Dynamic SQL

Naturally we have the ability to interface with Static SQL as well as Dynamic. Now, as all roads lead to Rome, or as I like to say “There is more than one way to skin a cat” – my co-workers don’t like that saying much for some reason… anyway, I digress – the interface to the dynamic RUNSTATS Rescue is the PLAN_TABLE owner and the QUERYNO used for the EXPLAIN. RUNSTATS Rescue does the rest –

so for static, there is a “simple” entry point. Just cut–and–paste the static SQL statement that is “causing grief” into SPUFI and EXPLAIN it, just as if it were dynamic SQL. However, the problem here, is that you must then manually generate all required REBINDs.

Top of page

Rescue „pure“ Static SQL

What we decided to do, is to create a new Pocket Tool extension for “pure” Static SQL. If you only have Dynamic SQL or if you only have Static SQL, then you will only need a single licence! The data that the new extension requires is all currently available in your SQL monitor, Trace etc. which tells you who the bad guy is, namely: Collection ID, Package name, Version and Statement Id. If you have this data *and* you have done your last BIND or REBIND with EXPLAIN(YES) – and I hope that’s true for 100% of production packages! – you are ready to rock’n’roll!

 Two prepare options

So this is how it will look. First we have a new option in the Menu selection list:

News 2014-02 Bild1


Here you can see that we now have two Prepare options: one is for Dynamic, and is the same as in last month’s newsletter, and the other is a new Static one which then leads you to the next pop–up:


  A REBIND step instead of a RUNSTATS step

News 2014-02 Bild2

Here you simply enter the required data and then, after it has been verified, you generate and run the RUNSTATS Rescue job, just like last time.

However, now you do not get a RUNSTATS step at the end of the job. Instead,  you’ll get a REBIND step for either the single PACKAGE or, if REBIND ALL is Y, for all affected PACKAGES in any COLLECTION. Obviously this option must be used “with care,” however, if the statistics are bad for one package why shouldn’t they be bad for all packages?


An errant Access path onto the good path

That’s it!

Now you have three ways to get an errant Access Path back onto the good path. (Remember that you can *always* cut–and–paste Static SQL into an EXPLAIN SPUFI – which means there are actually two ways to do Static).


Top of page

Next month

Next month I will go into detail about the DSC Protection scenario from our Bind ImpactExpert tool that is *really* cool and helps deal with the same type of problems but at a much higher and fully-integrated manner. It also completely handles the tricky question of :

“OK, so this query gets better when I reset my statistics but *this* query gets worse!”


As usual any questions or comments are welcome,
TTFN Roy Boxwell
Senior Software Architect

2014-03 Complementing IBMs ACCESS PLAN Stability


Part 3: DSC Protection

In the last Newsletter of this series about protecting your assets and/or access paths, I want to tell you how SOFTWARE ENGINEERING GmbH’s Bind Impact Expert DSC Protection works.

In the  previous Newsletter of the series (2014-01 Dynamic SQL  2014-02 Static SQL), we have seen how with RUNSTATS Rescue you can quickly and cheaply get back your old DB2 Catalog Access Path Statistics.


This is all well and good but then come the questions:
  1. How will a RUNSTATS affect my Dynamic SQL?

  2. What happens if I reset the statistics for this statement? What are the side effects?


DSC Protection was created in order to handle this. In a nut shell, it will:

  1. Extract all needed DDL from production (Optional if it is already on test of course!)
  2. Extract all needed catalog statistics from production
  3. Run a “special” RUNSTATS (More on this baby later)
  4. Extract all needed catalog statistics from the _HIST tables in production
  5. Capture and Explain the DSC from production
  6. Export DSC from production
  7. Transfer all data to test
  8. Now logoff from production and logon to test
  9. Create the DDL on test (Optional)
  10. Import the dynamic SQL
  11. Update all statistics in test from the extracted _HIST data
  12. Explain all SQL from production DSC
  13. Compare the “new” Access Paths
  14. If for a given DB.TS the access is only “improved”,create a DB.TS pair ready to send back to production for actual RUNSTATS
  15. If for a given access path the result is “worsened” or “changed” then reset the statistics back to the actual production statistics and re-analyse
  16. Keep going until no more access paths are worsened or changed
  17. Transfer the RUNSTATS control cards to production
  18. Logoff from test and logon to production
  19. Run a “normal” RUNSTATS using the transferred control cards
  20. You are done! Simple, huh?


We start at the Main Menu:


Select the DSC Protection scenario:

News 2014-03 DSC bild2


To begin use the primary command X to start the eXport chain of jobs:

News 2014-03 DSCbild3

Once you get to the blue line,

you must then run the “special” RUNSTATS.

What this does, is run the RUNSTATS but does not invalidate the DSC. We do not want to kill the good access paths, we want to see if a RUNSTATS will help us first *before* we really run the RUNSTATS! That is why the scenario is called DSC protection after all! It is there to protect your DSC from a mistimed RUNSTATS.


The HISTORY option *must* be ALL or ACCESSPATH

What is very important, is that the HISTORY option *must* be ALL or ACCESSPATH. This then fills the _HIST tables with data that we need later in the analysis. Here’s another “little” problem in the fact that there is no SYSTABLESPACE_HIST table! IBM “forgot it” years ago and it has never been created… This is why there is a “prepare extract” step, as we must create a VIEW which gives us a “fake” SYSTABLESPACE_HIST table as NACTIVEF is very good for the DB2 Optimizer if you ask me!

Once all of these steps have been done and you have file transferred all the needed files across to test, you can logoff from production and log onto the test machine.


Top of page


Here you select the DSC Protection scenario again:

News 2014-03 DSCbild4

Now you use I to Import the data:

Again you just run through the jobs a step at a time; DDL create is, of course, optional. Note that here we just apply the _HIST data – not the “current” statistics but the “future” statistics. When all of these steps are done you are then ready to use primary command N for a “new” run. Submit the job and wait for it to complete.

Once it has finished use Refresh to update the display:

News 2014-03 DSCbild6

and then you can use line command S to view the statements:

News 2014-03 DSCbild7

Here you see the overview and you can drill down to the statement level:

News 2014-03 DSCbild8

Note that on both these panels there is the R command for Reset statistics that simply adds the affected objects to an internal RUNSTATS reset table which at the entry panel can also be selected with an R:

News 2014-03 DSCbild9

Top of page

It then displays another pop-up with a short list of options:

News 2014-03 DSCbild10

Using the first option just shows you a list of the internal RUNSTATS table where you can see the Production and Test names of the objects (Of course you can rename all the extracted data)
and you may choose whether or not specific DB.TS pairs should be added to or removed from the table:

News 2014-03 DSCbild11


Once you have finished selecting your tables the next option should then look a little familiar to you all by now!


It uses the extracted statistics to build an update of the production data:

When it has finished and reset various statistics, you naturally want to re-run the EXPLAINs to see if the bad paths are now all gone, or perhaps even new worse ones have appeared! In my experience this never actually happens, but just to make absolutely sure, use the next option to re-generate the JCL and re-do the analysis. Now you can start all over again or you can see that all is ok. At this point you will now have a small list of DB.TS in the internal table that would actually give you guaranteed performance improvements if run on production.

Then you select the last option to see this:

News 2014-03 DSCbild13

Top of page

And these RUNSTATS should simply be executed on Production using the normal RUNSTATS utility JCL and with UPDATE ALL or ACCESSPATH. History no longer matters of course!

Now you are done! Easy peasy lemon squeezy! (Or Easy as pie if you prefer!) That, my dear readers, is why this is *not* a pocket tool and does *not* cost pocket money (Pin money).


As usual any questions or comments are welcome,
TTFN Roy Boxwell
Senior Software Architect

2014-04: Are you going to PIECEs?

This month I have a really nice – and rather long – technical newsletter to sink your teeth into!

The problem: Too low internal PIECE limit in DB2

The solution: Set of SQL queries for my newsletter readers to really find the bad guys

Create DBD diagnose cards
– Cut and paste the control cards into some DB2 Utility JCL
Do “F OBDINNUM” in the REPAIR job output
– Automatic parse the millions of lines of REPAIR output and *only* outputs OBIDs

 Whole SQL.txt           JCL.txt              REXX.txt

Reach your real maximum number of PIECEs!

The Problem:  Too low internal PIECE limit in DB2

We start with a little APAR that IBM did way back in 2013:

2013 IBM APAR

PM75150: ALLOW MAXIMUM NUMBER OF PIECES FOR AN NPI  OF LARGE TABLE SPACE, INDEPENDENT OF TABLE SPACE  MAXIMUM NUMBER OF DATASETS 

Reported release     A10
StatusCLOSED UR1
PENoPE
HIPERNoHIPER
Special AttentionNoSpecatt
Submitted date2012-10-16
Closed date2013-02-25
Last modified date2013-04-02

So far, so good. Looks like any run of the mill standard DB2 10 fix of “no real importance”… until you read the “small print” that is!


******************************************************************************************************************
 USERS AFFECTED: All DB2 users of Non-Partitioned Index  (NPI) on a large table space.
******************************************************************************************************************

PROBLEM DESCRIPTION:
For a large table space, the maximum   
number of pieces for an NPI is  incorrectly inherited from the
maximum number of partitions of the table space. When inserting data to a table or creating the NPI,
the customer 
may receive the following message,

DSNT501I  DMBC DSNKINSL RESOURCE UNAVAILABLE  CORRELATION-ID=QFSBTC036
CONNECTION-ID=SERVER  LUW-ID=  GAF263F9.C741.120818101839=561408
REASON 00C9009D
TYPE 00000201                          

****************************************************************************************************************
RECOMMENDATION:
****************************************************************************************************************
For an NPI on a LARGE(5-byte RID) table space, the index maximum number of pieces is independent of the table space maximum number of partitions, it is calculated from index page size and piece size as the following:

Maximum NPI number of pieces = MINIMUM( 4096, 2^32 / (index piece size/index page size) )


In other words, DB2 set the internal piece limit way too low!
This is very bad news if you think you have 4,096 pieces but you really have only 256!

Now the APAR carries on with helpful hints and tips (Quoting here from the APAR text):


Top of page


1. run a query, such as the sample query below, to identify the databases, table spaces and indexes,

SELECT TS.DBNAME AS DB_NAME,
       TS.NAME AS TS_NAME,
       IX.NAME AS INDEX_NAME,
       IX.CREATOR AS IX_CREATOR,
       HEX(IX.OBID) AS INDEX_OBID,
       IX.CLOSERULE AS CLOSERULE
FROM   SYSIBM.SYSINDEXES IX,
       SYSIBM.SYSTABLES TB,
       SYSIBM.SYSTABLESPACE TS
WHERE  TB.NAME = IX.TBNAME AND
       TB.CREATOR = IX.TBCREATOR AND
       TB.TSNAME = TS.NAME AND
       TB.DBNAME = TS.DBNAME AND
       (TS.PARTITIONS > 254 OR
        TS.TYPE = 'L' OR
        TS.TYPE = 'K' OR
        TS.DSSIZE > 0) AND
        TS.PARTITIONS <> 0 AND
        (TS.STATUS = 'C' OR
        NOT ((IX.INDEXTYPE = 'P' OR
        IX.INDEXTYPE = 'D') AND
        TB.PARTKEYCOLNUM <>0)) AND
        TS.DBNAME <> 'DSNDB06'
ORDER BY IX.OBID;
+-------------------------------------------------------------+
|DB_NAME |TS_NAME |INDEX_NAME|IX_CREATOR|INDEX_OBID|CLOSERULE |
+-------------------------------------------------------------+
|DB161410|XTB10000|I_NODEIDXT|SC161410  |0056      |N         |
|DB161410|TU161410|I_DOCIDTB1|SC161410  |0058      |N         |
 ...
 
2. run REPAIR DBD DIAGNOSE against all databases from the above query.
 
For example REPAIR DBD DB161410. By searching OBDINNUM in the REPAIR DBD output, it has the following mismatch,
 
DSNU916I DSNUEDFT - OBDS DIFFER AT OFFSET X'00000052'
OBDINNUM - INFORMATION NOT IN DB2 CATALOG
DSNU904I DSNUEDFT - EXISTING VALUE  X'0100'
DSNU905I DSNUEDFT - REBUILT  VALUE  X'1000'
DSNU913I DSNUEDDR - OBD X'0056' COMPARISON COMPLETE -- 0 ERRORS
 
which confirms the index index I_NODEIDXT with OBID X'0056' has incorrect maximum number of index pieces.
 
3. fix these indexes found in the above repair DBD output by altering the CLOSE attribute of the identified indexes from their current value and then altering the CLOSE attribute back to their original value. The index name and index attribute information can be found in the query result at step 1.
 
for example, the index SC161410.I_NODEIDXT has the CLOSE attribute CLOSERULE = N. To correct the maximum number of index pieces for I_NODEIDXT, run the following DDL
 
   ALTER INDEX index SC161410.I_NODEIDXT CLOSE YES
   ALTER INDEX index SC161410.I_NODEIDXT CLOSE NO


So what I decided to do, was to create a set of queries for my newsletter readers to make this process a tad easier to really find the bad guys!


Top of page

The solution: Set of SQL queries for my newsletter readers to really find the bad guys

Whole SQL.txt           JCL.txt              REXX.txt


Create DBD diagnose cards

First step is nearly the same SQL as in 1. Above:

-- CREATE DBD DIAGNOSE CARDS FOR ANY DATABASES THAT ARE CANDIDATES  
SELECT DISTINCT SUBSTR('  REPAIR OBJECT LOG YES DBD DIAGNOSE DATABASE '
CONCAT STRIP(TS.DBNAME) , 1 , 54 )              
FROM SYSIBM.SYSINDEXES    IX,                                        
     SYSIBM.SYSTABLES     TB,
     SYSIBM.SYSTABLESPACE TS                                       
WHERE TB.NAME    = IX.TBNAME                                         
   AND TB.CREATOR = IX.TBCREATOR                                      
   AND TB.TSNAME  = TS.NAME                                           
   AND TB.DBNAME  = TS.DBNAME                                         
   AND (TS.PARTITIONS > 254                                           
     OR TS.TYPE       = 'L'                                           
     OR TS.TYPE       = 'K'                                           
     OR TS.DSSIZE     > 0)                                            
   AND TS.PARTITIONS <> 0                                             
   AND (TS.STATUS = 'C'                                               
     OR NOT ((IX.INDEXTYPE = 'P'                                      
           OR IX.INDEXTYPE = 'D')                                     
        AND TB.PARTKEYCOLNUM <> 0))                                  
   AND TS.DBNAME <> 'DSNDB06'                                         

;

It returns this style of output (If you have *no* output then congratulations you have *no* problem!):

REPAIR OBJECT LOG YES DBD DIAGNOSE DATABASE A140XO82
REPAIR OBJECT LOG YES DBD DIAGNOSE DATABASE ANKDB1  
REPAIR OBJECT LOG YES DBD DIAGNOSE DATABASE ANKDB3
.
.
.

Top of page


Cut and paste these control cards into some DB2 Utility JCL

Now you must cut and paste these control cards into some DB2 Utility JCL and get them all run.

The next query lists out all the index data you need from the above databases:


-- NOW LIST INDEX OBID'S ON THE ABOVE DATABASES THAT MUST BE SEARCHED
-- FOR IN THE REPAIR SYSOUT BY USING "F OBDINNUM" AND CHECKING IF THE
-- OBID'S MATCH                                                 
SELECT SUBSTR(TS.DBNAME , 1 , 8)       AS DB_NAME,                
       HEX(IX.OBID)                    AS INDEX_OBID,                
       SUBSTR(STRIP(IX.CREATOR) CONCAT '.' CONCAT                    
              STRIP(IX.NAME) , 1 , 71) AS INDEX                       
       FROM SYSIBM.SYSINDEXES    IX,                                      
       SYSIBM.SYSTABLES     TB,                                      
       SYSIBM.SYSTABLESPACE TS                                       
  WHERE TB.NAME    = IX.TBNAME                                       
    AND TB.CREATOR = IX.TBCREATOR                                    
    AND TB.TSNAME  = TS.NAME                                         
    AND TB.DBNAME  = TS.DBNAME                                       
    AND (TS.PARTITIONS > 254                                         
      OR TS.TYPE       = 'L'                                         
      OR TS.TYPE       = 'K'                                         
      OR TS.DSSIZE     > 0)                                          
    AND TS.PARTITIONS <> 0                                           
    AND (TS.STATUS = 'C'                                             
      OR NOT ((IX.INDEXTYPE = 'P'                                    
            OR IX.INDEXTYPE = 'D')                                   
          AND TB.PARTKEYCOLNUM <> 0))                                
    AND TS.DBNAME <> 'DSNDB06'                                       
  ORDER BY 1 , 2 
;

The output looks like:

---------+---------+---------+---------+----------
 DB_NAME   INDEX_OBID  INDEX 
---------+---------+---------+---------+---------
 A140XO82  000C        USER001.RESB~0
 ANKDB1    000A        ANKDB1.ANKIX11
 ANKDB3    0008        ANKDB3.ANKIX3 . . .

Do “F OBDINNUM” in the REPAIR job output

Now comes the really horrible bit – you must now do “F OBDINNUM” in the REPAIR job output and see if you have any matches for the above indexes in the relevant database. Again, if you have none then congratulations, you have no problem!

If you find data like this (just as in the IBM APAR description):

DSNU916I DSNUEDFT - OBDS DIFFER AT OFFSET X'00000052'
OBDINNUM - INFORMATION NOT IN DB2 CATALOG
DSNU904I DSNUEDFT - EXISTING VALUE  X'0100'
DSNU905I DSNUEDFT - REBUILT  VALUE  X'1000'
DSNU913I DSNUEDDR - OBD X'0056' COMPARISON COMPLETE -- 0 ERRORS

Top of page


then you must now do the next step to generate the corrective ALTER flip-flops:

-- CREATE DRIVER TABLE FOR CARTESIAN JOIN PROCESSING     
DECLARE GLOBAL TEMPORARY TABLE DRIVER (NUMBER SMALLINT) ;
INSERT INTO SESSION.DRIVER VALUES 1 ;                    
INSERT INTO SESSION.DRIVER VALUES 2 ;                    
INSERT INTO SESSION.DRIVER VALUES 3 ;                    
INSERT INTO SESSION.DRIVER VALUES 4 ;                    
INSERT INTO SESSION.DRIVER VALUES 5 ;                    
INSERT INTO SESSION.DRIVER VALUES 6 ;                    
-- NOW GENERATE CORRECTIVE CLOSE FLIPS ONE FOR NO -> YES           
-- AND ONE FOR YES -> NO                                           
-- NO -> YES CLOSERULE FLIP CONTROL CARDS                          
WITH T1 ( IXNAME                                                   
        , DBNAME                                                   
        , OBID)                                                    
     AS ( SELECT STRIP(IX.CREATOR) CONCAT '.' CONCAT STRIP(IX.NAME)
               , TS.DBNAME                                         
               , IX.OBID                                           
          FROM SYSIBM.SYSINDEXES IX,                               
               SYSIBM.SYSTABLES TB,                                
               SYSIBM.SYSTABLESPACE TS                             
          WHERE TB.NAME    = IX.TBNAME                             
            AND TB.CREATOR = IX.TBCREATOR                          
            AND TB.TSNAME  = TS.NAME                               
            AND TB.DBNAME  = TS.DBNAME                             
            AND (TS.PARTITIONS > 254                               
              OR TS.TYPE       = 'L'                               
              OR TS.TYPE       = 'K'                               
              OR TS.DSSIZE     > 0)                                
            AND TS.PARTITIONS <> 0                                 
            AND (TS.STATUS = 'C'                                   
              OR NOT ((IX.INDEXTYPE = 'P'                          
                    OR IX.INDEXTYPE = 'D')                         
                  AND TB.PARTKEYCOLNUM <> 0))                      
            AND TS.DBNAME <> 'DSNDB06'                             
            AND IX.CLOSERULE = 'N'                                 
          ORDER BY TS.DBNAME , HEX(IX.OBID)                        
        )                                                          
SELECT CAST(CASE NUMBER              
            WHEN 1 THEN 'ALTER INDEX'
            WHEN 2 THEN IXNAME       
            WHEN 3 THEN 'CLOSE YES $'
            WHEN 4 THEN 'ALTER INDEX'
            WHEN 5 THEN IXNAME       
            WHEN 6 THEN 'CLOSE NO  $'
            END AS CHAR(72))         
FROM T1, SESSION.DRIVER              
ORDER BY DBNAME, OBID, NUMBER        
;                                

Which generates the first set of flip-flops from YES -> NO:

ALTER INDEX                               
D9999TOP.BADBIGIX                         
CLOSE YES $                               
ALTER INDEX                               
D9999TOP.BADBIGIX                         
CLOSE NO  $                               
ALTER INDEX                               
D9999TOP.BADBIGIB                         
CLOSE YES $                               
ALTER INDEX                               
D9999TOP.BADBIGIB                         
CLOSE NO  $      
And then the next flip-flop:
-- CREATE DRIVER TABLE FOR CARTESIAN JOIN PROCESSING     
DECLARE GLOBAL TEMPORARY TABLE DRIVER (NUMBER SMALLINT) ;
INSERT INTO SESSION.DRIVER VALUES 1 ;                    
INSERT INTO SESSION.DRIVER VALUES 2 ;                    
INSERT INTO SESSION.DRIVER VALUES 3 ;                    
INSERT INTO SESSION.DRIVER VALUES 4 ;                    
INSERT INTO SESSION.DRIVER VALUES 5 ;                    
INSERT INTO SESSION.DRIVER VALUES 6 ;                    
-- YES -> NO CLOSERULE FLIP CONTROL CARDS                          
WITH T1 ( IXNAME                                                   
        , DBNAME                                                   
        , OBID)                                                    
     AS ( SELECT STRIP(IX.CREATOR) CONCAT '.' CONCAT STRIP(IX.NAME)
               , TS.DBNAME                                         
               , IX.OBID                                           
          FROM SYSIBM.SYSINDEXES IX,                               
               SYSIBM.SYSTABLES TB,                                
               SYSIBM.SYSTABLESPACE TS                             
          WHERE TB.NAME    = IX.TBNAME                             
            AND TB.CREATOR = IX.TBCREATOR                          
            AND TB.TSNAME  = TS.NAME                               
            AND TB.DBNAME  = TS.DBNAME                             
            AND (TS.PARTITIONS > 254                               
              OR TS.TYPE       = 'L'                               
              OR TS.TYPE       = 'K'                               
              OR TS.DSSIZE     > 0)                                
            AND TS.PARTITIONS <> 0                                 
            AND (TS.STATUS = 'C'                                   
              OR NOT ((IX.INDEXTYPE = 'P'                          
                    OR IX.INDEXTYPE = 'D')                         
                  AND TB.PARTKEYCOLNUM <> 0))                      
            AND TS.DBNAME <> 'DSNDB06'                             
            AND IX.CLOSERULE = 'Y'                                 
          ORDER BY TS.DBNAME , HEX(IX.OBID)                        
        )                                                          
SELECT CAST(CASE NUMBER              
            WHEN 1 THEN 'ALTER INDEX'
            WHEN 2 THEN IXNAME       
            WHEN 3 THEN 'CLOSE NO  $'
            WHEN 4 THEN 'ALTER INDEX'
            WHEN 5 THEN IXNAME       
            WHEN 6 THEN 'CLOSE YES $'
            END AS CHAR(72))         
FROM T1, SESSION.DRIVER              
ORDER BY DBNAME, OBID, NUMBER        
;
Which generates NO -> YES format:
ALTER INDEX                               
USER001.RESB~0                            
CLOSE NO  $                               
ALTER INDEX                               
USER001.RESB~0                            
CLOSE YES $  


Top of page


Note that the above ALTERs use a $ as terminator, so you must either use a C ALL $ ; style ISPF command or just use a –#SET TERMINATOR $ line in the SPUFI.

Automatic parse of the millions of lines of REPAIR output and *only* outputs OBIDs

At this point, when even I had a HUGE list of candidates, I decided to automate it even further so I wrote a little REXX that parses the millions of lines of REPAIR output and *only* outputs OBIDs for real bad guys. That way you can see what you really have to do very quickly. Here’s how my output looks:

Began checking at: 2014-02-11-12.34.08.752641
Database A140XO82 started.                   
Database A140XO82 ended.                     
Database ANKDB1   started.                   
Database ANKDB1   ended.                     
Database ANKDB3   started.                   
Database ANKDB3   ended.                     
Database D9999TOP started.                   
OBID X'0004' is X'0100' rebuilt X'1000'      
OBID X'0006' is X'0100' rebuilt X'1000'      
OBID X'0008' is X'0100' rebuilt X'1000'      
OBID X'000A' is X'0100' rebuilt X'1000'      
OBID X'000C' is X'0100' rebuilt X'1000'      
OBID X'000E' is X'0100' rebuilt X'1000'      
OBID X'0010' is X'0100' rebuilt X'1000'      
Database D9999TOP ended.                     
Database DATAPBG2 started.                   
Database DATAPBG2 ended.                     
.
.
.

Here you can see that my first actual problem database is the D9999TOP. When I then plug that into my flip flop generator by using cut-and-paste, for both cases, like this:

AND TB.DBNAME  = 'D9999TOP' 
  AND HEX(IX.OBID) IN (       
                  '0004'      
                , '0006'      
                , '0008'      
                , '000A'      
                , '000C'      
                , '000E'      
                , '0010'      
                 )   

I get the following output:

ALTER INDEX      
D9999TOP.BADBIGIA
CLOSE YES $      
ALTER INDEX      
D9999TOP.BADBIGIA 
CLOSE NO  $      
ALTER INDEX      
D9999TOP.BADBIGIB 
CLOSE YES $      
ALTER INDEX      
D9999TOP.BADBIGIB 
CLOSE NO  $      
ALTER INDEX      
D9999TOP.BADBIGIC
CLOSE YES $      
ALTER INDEX      
D9999TOP.BADBIGIC
CLOSE NO  $      
ALTER INDEX      
D9999TOP.BADBIGID
CLOSE YES $      
ALTER INDEX      
D9999TOP.BADBIGID
CLOSE NO  $      
ALTER INDEX      
D9999TOP.BADBIGIE
CLOSE YES $      
ALTER INDEX      
D9999TOP.BADBIGIE
CLOSE NO  $      
ALTER INDEX      
D9999TOP.BADBIGIF
CLOSE YES $      
ALTER INDEX      
D9999TOP.BADBIGIF
CLOSE NO  $      
ALTER INDEX      
D9999TOP.BADBIGIG
CLOSE YES $      
ALTER INDEX      
D9999TOP.BADBIGIG
CLOSE NO  $

Top of page

Reach your real maximum number of pieces!

There was no output from the other query, so once these ALTERs ran my work on this database was done and I could happily move onto the next.

This is much quicker than searching through REPAIR sysout! The REXX should be copied to a PROC library and called NPI. Then using the JCL (which must tailored for your site, of course!) to execute it – and Bob’s your uncle!

Once all of the ALTERs have been executed then, finally, all of your NPIs can actually reach their real maximum number of pieces!
This month I also used (stole!) the neat Cartesian Join idea from Marcus Davage’s blog: http://spufidoo.wordpress.com/2013/02/28/judicious-cartesian-joins/

that was posted on Listserv and everyone loved it instantly!


As usual any questions or comments are welcome,
TTFN Roy Boxwell
Senior Software Architect