What you can actually seeis not everything that is really there… |  |
The never-seen-before Static SQL Statements
I’ve been involved in reviewing some data provided by our new SQL WorkloadExpert tool (aka WLX). Over the past weeks, the one thing that I’ve seen time and time again, is the sheer number of Static SQLs that are running – and I mean running badly!
In the past, unless you always monitored 24×7, you never really had a chance to see all the static SQL that was running on your Plex. But now WLX makes for a real game changer!
It’s amazing what you can see – without the cost of a 24×7 Monitor.
I liken it to the phrase “Eyes Wide Shut”.
What you can do in WLX is a different way to find bad guy SQLs and that is by using an intensive view to find the SQLs that use a large amount of CPU per hour. I call these guys my “key-players” now some of these are obviously “old friends” but you will be surprised at how many “new contacts” you suddenly have!
Here are a couple of beautiful little examples that I found by using WLX to show me the most CPU intensive SQLs running on a Plex over a couple of days.
Viewing the static SQL
First query found now, and not seen before, looks like:
SELECT COL1
FROM TABLE1 T1
WHERE T1.IDENT = ?
AND T1.STATUS NOT IN ( 4, 6 )
WITH UR
Our systematic history viewer displays the following. The left hand scale is seconds and the right hand scale is logarithmic absolute numbers:
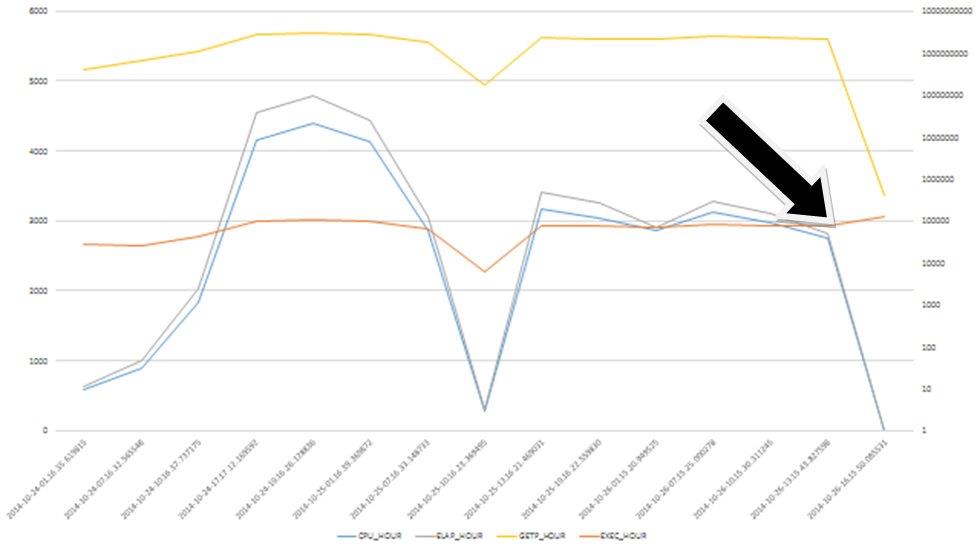
Shown here above are the CPU and the Elapsed Time, both per hour and in seconds. Then Getpages and Executions, both per hour and logarithmically graphed.
What you can see on the right side of the graph, is a dramatic drop in CPU and Elapsed and Getpages while the execution rate is constant. This was achieved by simply adding an appropriate index for that query.
Viewing the SQL from a different angle
Viewing the same data in a different way, (now on the per execution level instead of the per hour level) the results shown below look even better! (The left hand scale is seconds and the right hand scale is absolute numbers):
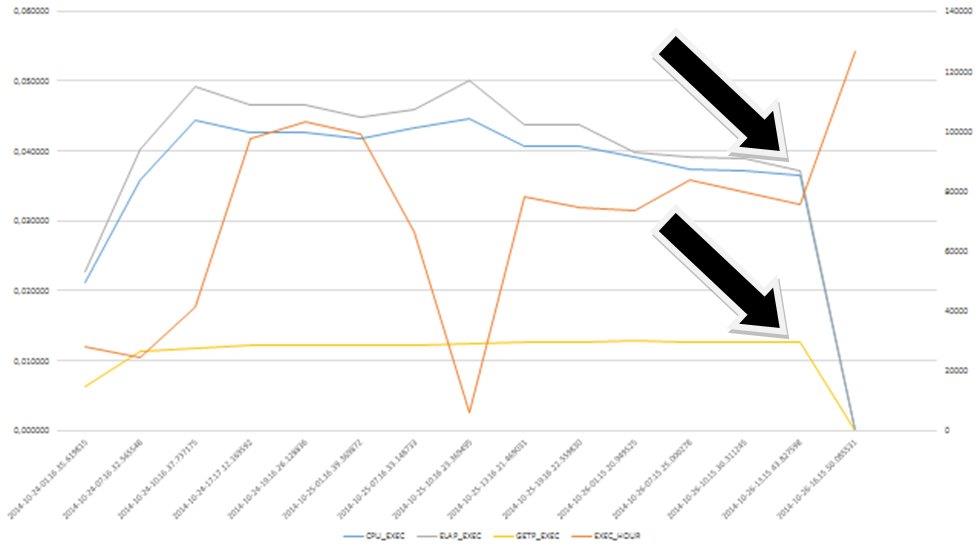
The Execution rate went *up*, but the resource usage dived down after the index was created – Great stuff indeed! This statement always flew under the radar and never raised a red flag before, but now? Slaps on the back all round!
Of course you could ask “Why was this not seen before?”
the answer is “It was never seen before!” Eyes wide shut – remember?
The same in tabular form
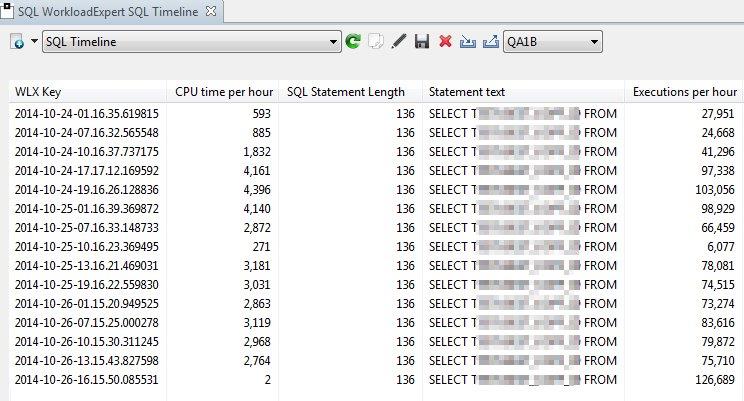
For those of you who may find the graphs hard to read, here’s the above data in a tabular form:

Never-seen-before DELETE Statement
Next up, is a nice Little never-seen-before DELETE Statement:
DELETE FROM TABLE1
WHERE COL1 = ?
AND   COL2_DATE = ?
AND   COL3 = ?
AND   COL4 = ?
AND   COL5 = ?
AND   COL6 = ?
AND   COL7 = ?
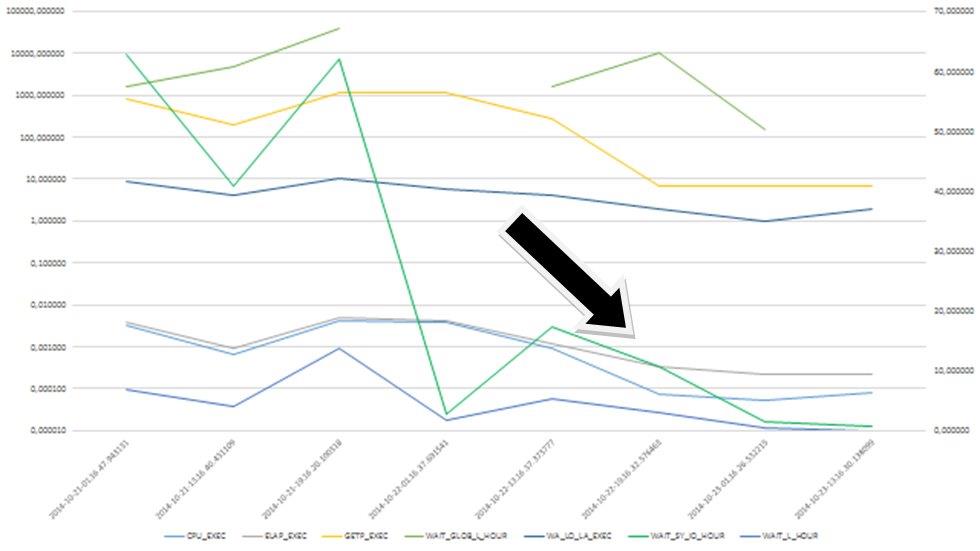
In the graph below, the left hand scale is seconds and the right hand scale is logarithmic absolute numbers:
4(9)
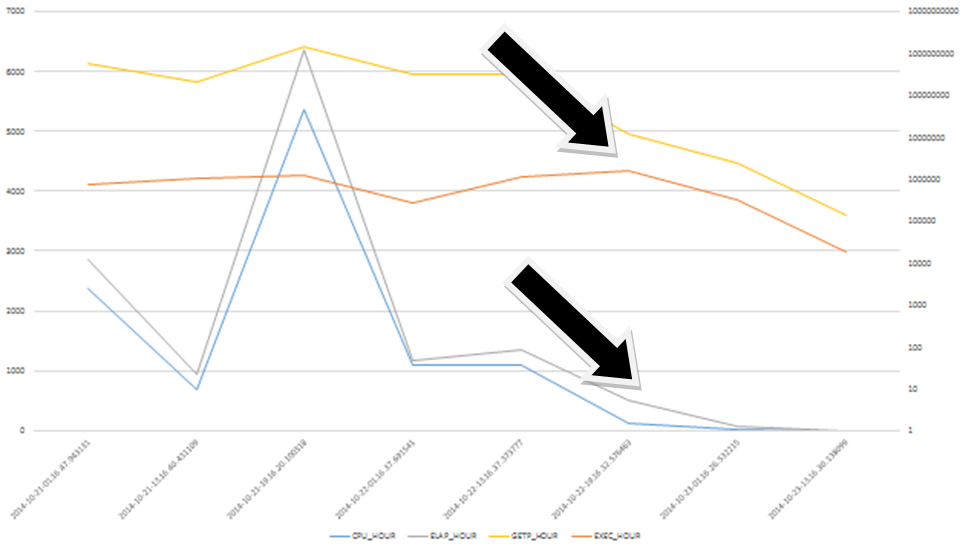
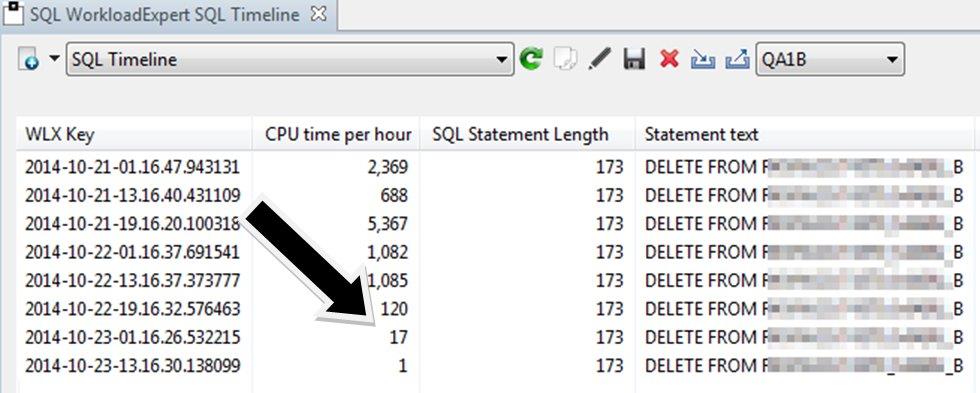
Again, looking at the per hour data, you can see a nice “dive” effect right after an index on all columns was created (Last three data points in this case). Good catch, eh?
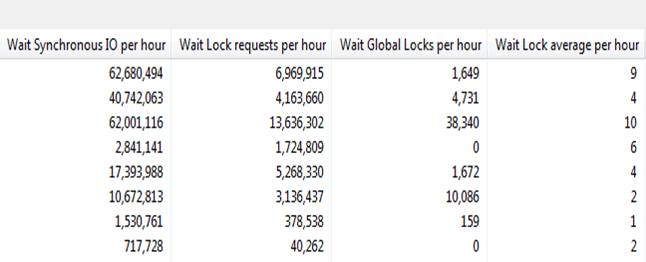
Below is a new view of additional data for locks and waits. Note that the Global Lock wait count magically “disappears” due to it hitting zero. Again you can see the graph very nicely diving down at the end. Wonderful!
Again: here’s the above data in a tabular form:

What you can actually see is not everything that is really there…
These examples quickly show how Static SQL that was always thought to be well-tuned and running “OK” can, in fact, be hogging your machine without you even knowing it!
Remember that what you can actually see is not everything that is really there…
I wonder how many of these invisible hogs you have at your site? And have you*not* yet seen them?
As usual any queries or criticism gladly accepted!
TTFN
Roy Boxwell

